I came across a LinkedIn post about the Exclusive Self Attention by Zhai et al. (Apple, 2026, arXiv:2603.09078).
The core idea is surprisingly simple: standard attention has a structural problem, in that each token’s output tends to align with its own value vector instead of aggregating information from the context.
It’s as if the mechanism that should be looking outward ends up looking inward.
The authors call this phenomenon attention similarity bias and measure it on very large models, showing that the situation worsens layer after layer, with a clear, reproducible increasing trend.
I wanted to verify it myself on GPT-2 using TransformerLens, because it lets you open a model while it runs and read what’s happening inside — activations, attention weights, intermediate outputs. With that you can look layer by layer.
For the sake of experimentation and given my limitations (I’m certainly not a researcher), I restricted myself to measuring the same three quantities from Figure 1 of the paper:
- the similarity between token value vectors
- the weight each token assigns to itself in the attention pattern
- the cosine similarity between the attention output and the token’s own value vector
A token’s value vector is a projection of its representation, built before attention looks at the context. So attention should take the value vectors of the other tokens, weight them, and return something new.
If instead the output ends up aligned with its own value vector, the token has given too much weight to itself during aggregation, and the result is nearly indistinguishable from what you’d get by ignoring everyone else.
The cosine similarity between the output and the self-value vector measures exactly this: if it’s high, attention hasn’t added information — it’s just copied.
The paper says: the deeper you go, the more the bias grows. I found something different: a U-shape.
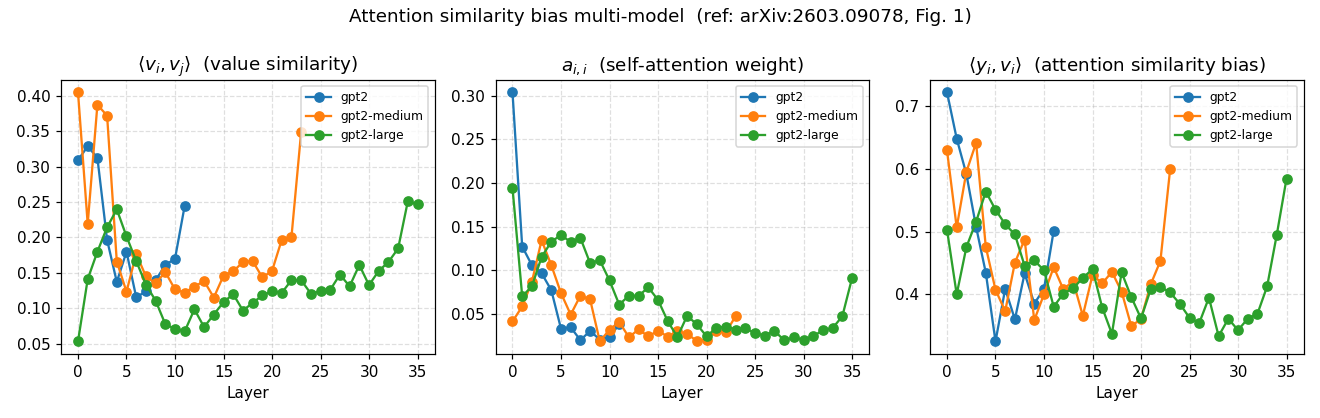
High in the early layers, it drops toward the middle, then rises slightly at the end. The shape repeats across GPT-2 small, medium, and large, with one interesting detail: the minimum shifts further toward the end as the model grows — roughly halfway through for small, around 80% depth for medium and large.
There’s something else worth noting. If I look only at the trend between the first and last layer, the value goes from negative (small, 0.22) to flat (medium, 0.03) to positive (large, +0.08). That is, the larger the model, the closer the first-vs-last comparison gets to the paper’s increasing trend. The U-shape in the middle remains, though, and that the paper doesn’t predict.
One final note: gpt2-medium and gpt2-large show a sharp uptick in the last layers, accompanied by an increase in value vector similarity. That’s probably proximity to the unembedding rather than the phenomenon described in the paper, but I’ll leave it open.
I don’t have a definitive explanation for the overall picture. The obvious hypotheses: the models are different (GPT-2 is trained on WebText, the paper uses more recent architectures on FineWeb), or there’s a difference in how I extracted the activations, or the trend only emerges at larger scales. Possibly all three at once.
I can’t resolve it on my own. I’m leaving it open because it seems honest to do so, and because the question is more interesting than the answer I don’t have.